Creating Illustrator Infographics (2022)
 2022-06-14

 1 435
1 435
 0
0
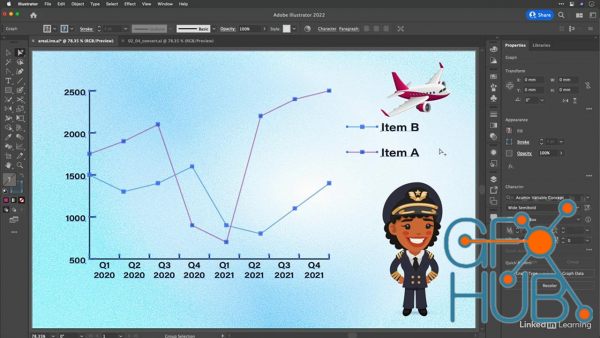
Lynda - Creating Illustrator Infographics (2022).
Infographics are everywhere. These data-driven illustrations visualize your data and help to tell the story behind it. In this course, Tony Harmer shows how to design charts, graphs, and other infographic assets in Adobe Illustrator. Learn how to get started by developing core skills, including the ability to create and customize basic images, charts and graphs, and illustrated tables that link to your data. Explore the five key components of a great information design with step-by-step tips on how to achieve it. Tony walks you through the many different graph types available in the latest version of Illustrator, including extendable charts, timelines and poster options, embellishments, add-ons, and more. By the end of this course, you’ll be prepared to choose the infographic option that’s best for you and your data.
Download links:


Illustrator/Graphics Design tuts


Comments
Add comment
Tags
Archive
| « July 2026 » | ||||||
|---|---|---|---|---|---|---|
| Mon | Tue | Wed | Thu | Fri | Sat | Sun |
| 1 | 2 | 3 | 4 | 5 | ||
| 6 | 7 | 8 | 9 | 10 | 11 | 12 |
| 13 | 14 | 15 | 16 | 17 | 18 | 19 |
| 20 | 21 | 22 | 23 | 24 | 25 | 26 |
| 27 | 28 | 29 | 30 | 31 | ||
Vote

New Daz3D, Poser stuff


New Books, Magazines